Brief Guide to Start Program Quickly
FitVac™ is always the latest version.
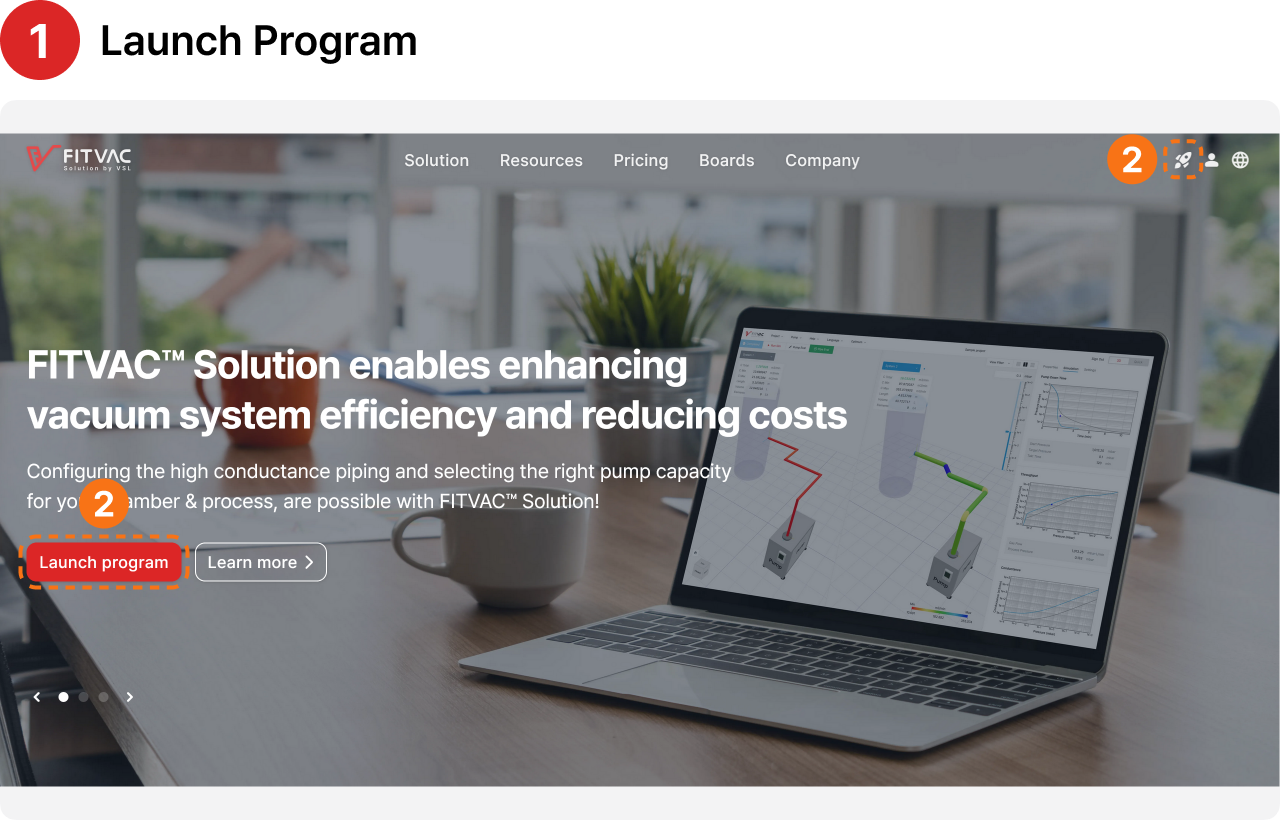
- Sign in
- If you received an email about the free trial after signing up, the "Launch program" button will be activated when you sign in
- Program launch
- Click the "Launch program" button to launch the program
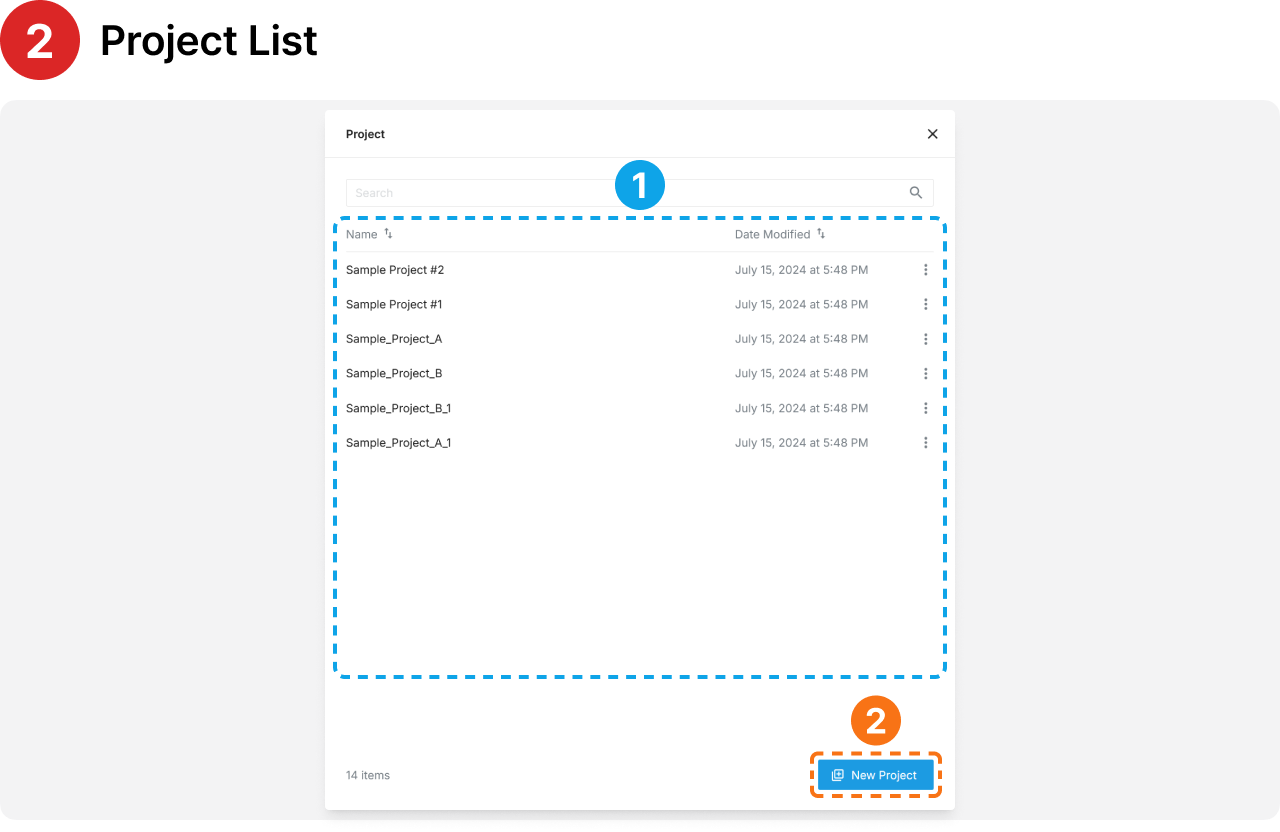
- Open a project
- You can open it by selecting a project saved in the Project list or by importing a project file saved in local
- Create a new project
- Click the "New Project" button to create a new project
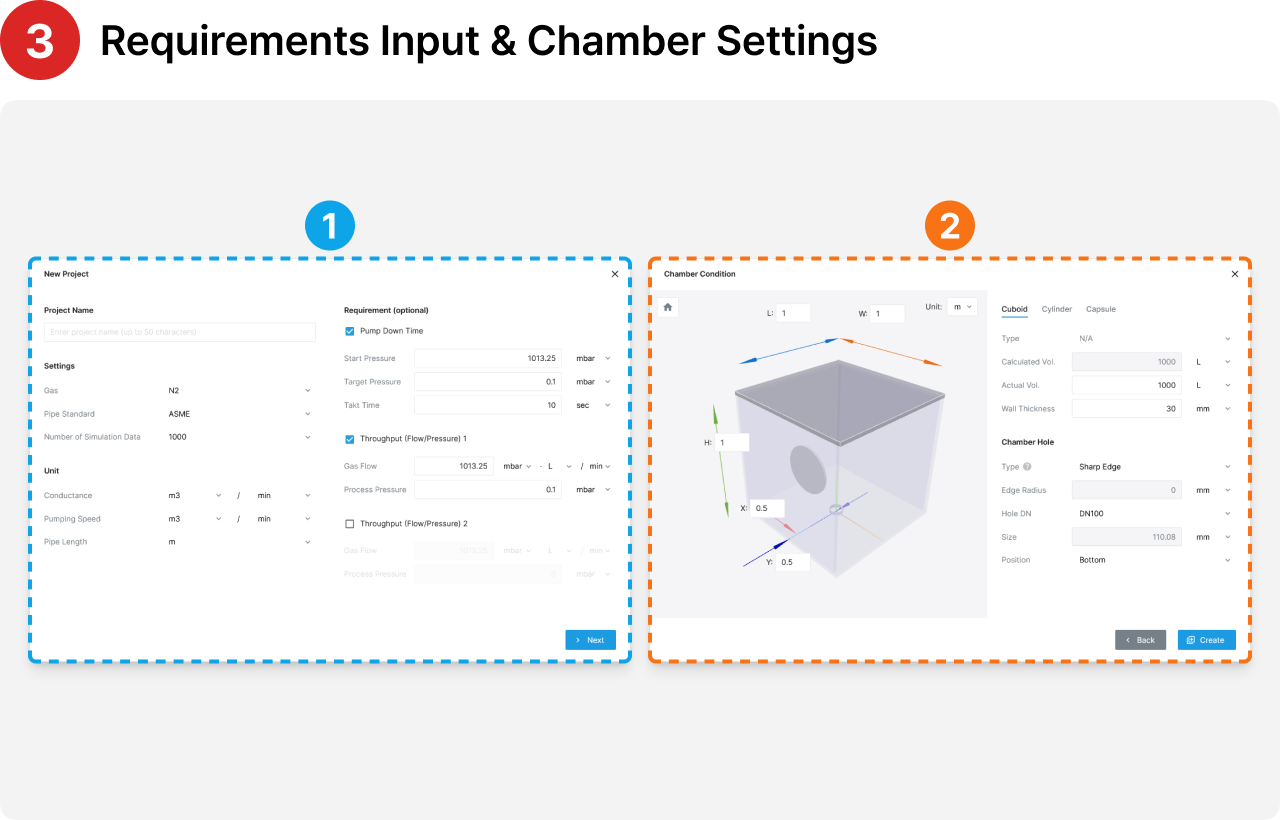
- Enter the project name and requirements
- Select the gas
- Enter the temperature
- Select the pipe standard
- Select the number of simulation data
- Select the units
- Enter the requirements for pump down time, throughput, and conductance
- Set up the chamber
- Enter chamber conditions from chamber type to hole position
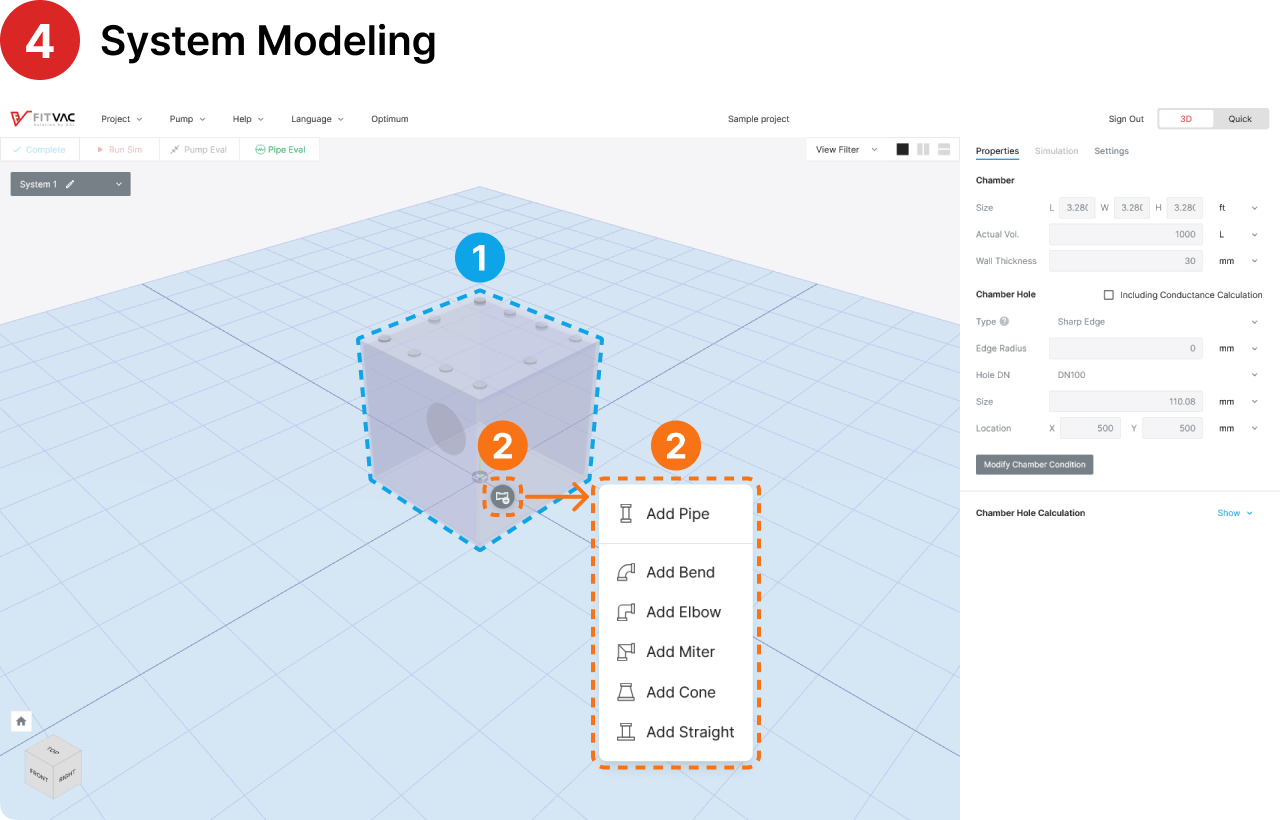
- System modeling
- The chamber you set up is placed on a grid in 3D space
- Pipe modeling
- Click the pipe icon button to expand the modeling menu
- Select a pipe element to configure the pipe
- Enter additional information for each pipe in the Properties tab on the right
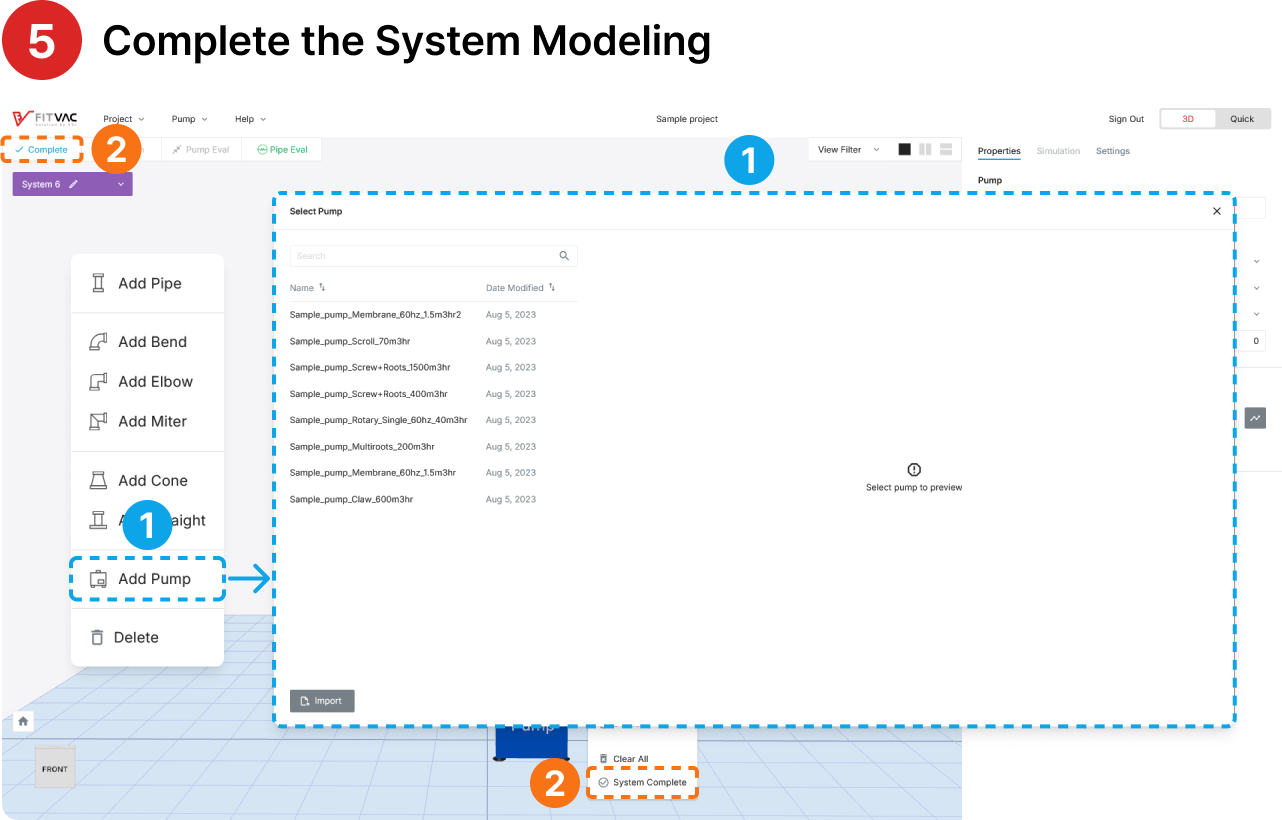
- Pump Modeling
- The pump is uploaded by clicking "Add Pump" to select from the list
- The pump can be used by selecting a sample pump or creating your own
- Modeling is complete when the system is configured with a chamber, pipes, and a pump
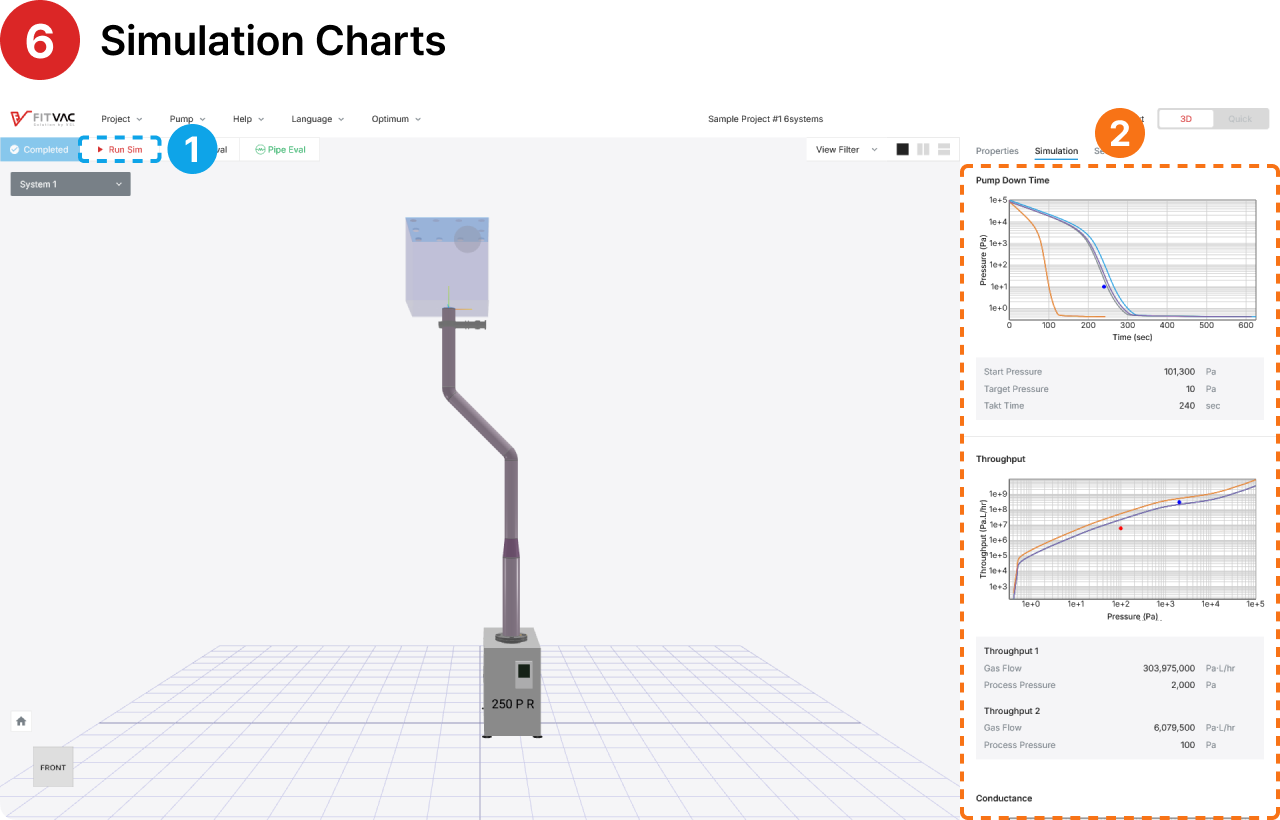
- Run the simulation
- Click the "Run Sim" button to run the simulation for the completed system
- Simulation results
- 4 simulation results charts are displayed on the right side of the screen (orange box)
- Conductance
- Effective pumping speed
- Pump down time
- Throughput
- The vacuum requirement is also shown on the chart (dot)
- Click on the chart to make it pop up and view detailed data
- 4 simulation results charts are displayed on the right side of the screen (orange box)
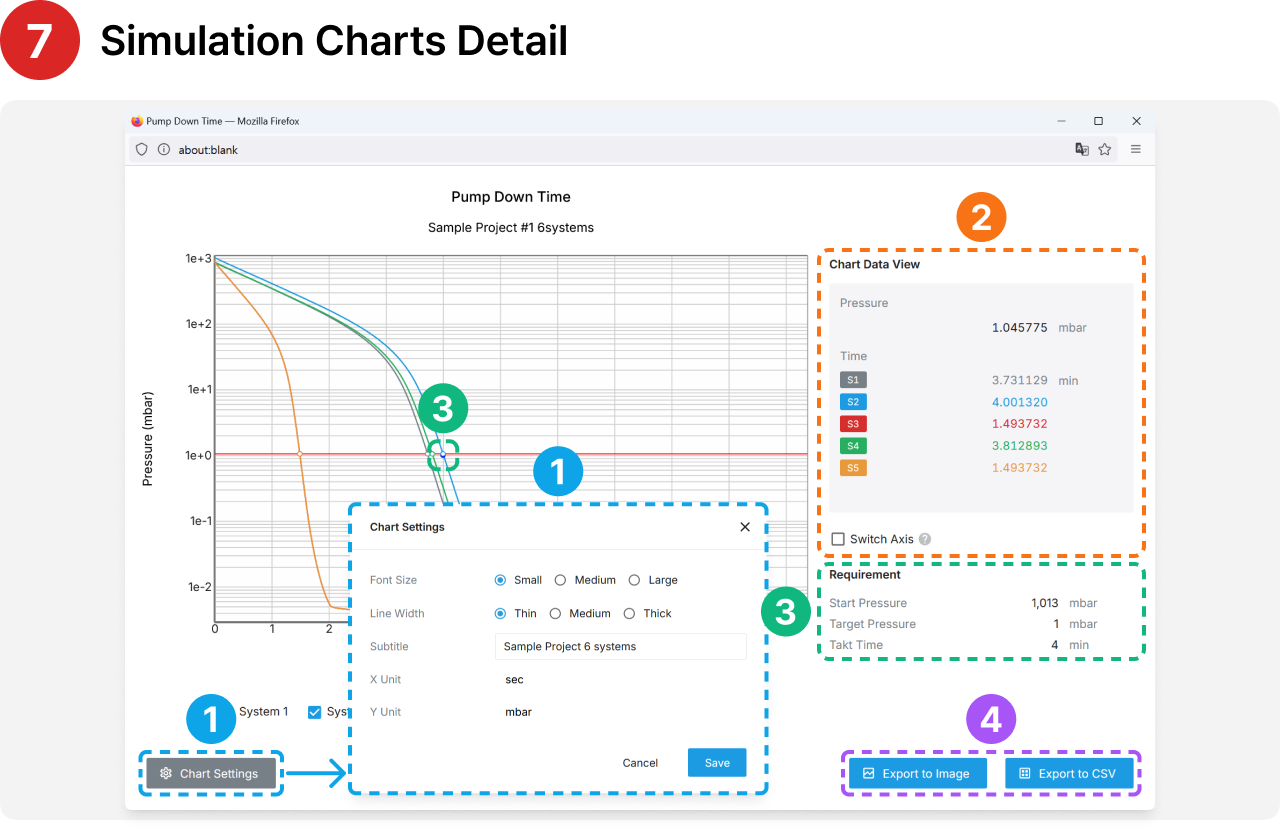
- Chart settings
- You can set up the charts by clicking the "settings Chart Settings" button
- Font size, subheading
- X, Y axis units
- You can set up the charts by clicking the "settings Chart Settings" button
- View simulation data
- Select "Switch Base Axis" option to view simulation results in detail
- Vacuum requirement
- Displayed on the chart as a small points(red point and blue point)
- Download simulation data
- Click the "Export to Image" button to export the chart to an image
- Click the "Export to CSV" button to export the chart to a CSV file
- Sign in
- If you received an email about the free trial after signing up, the "Launch program" button will be activated when you sign in
- Program launch
- Click the "Launch program" button to launch the program
- Open a project
- You can open it by selecting a project saved in the Project list or by importing a project file saved in local
- Create a new project
- Click the "New Project" button to create a new project
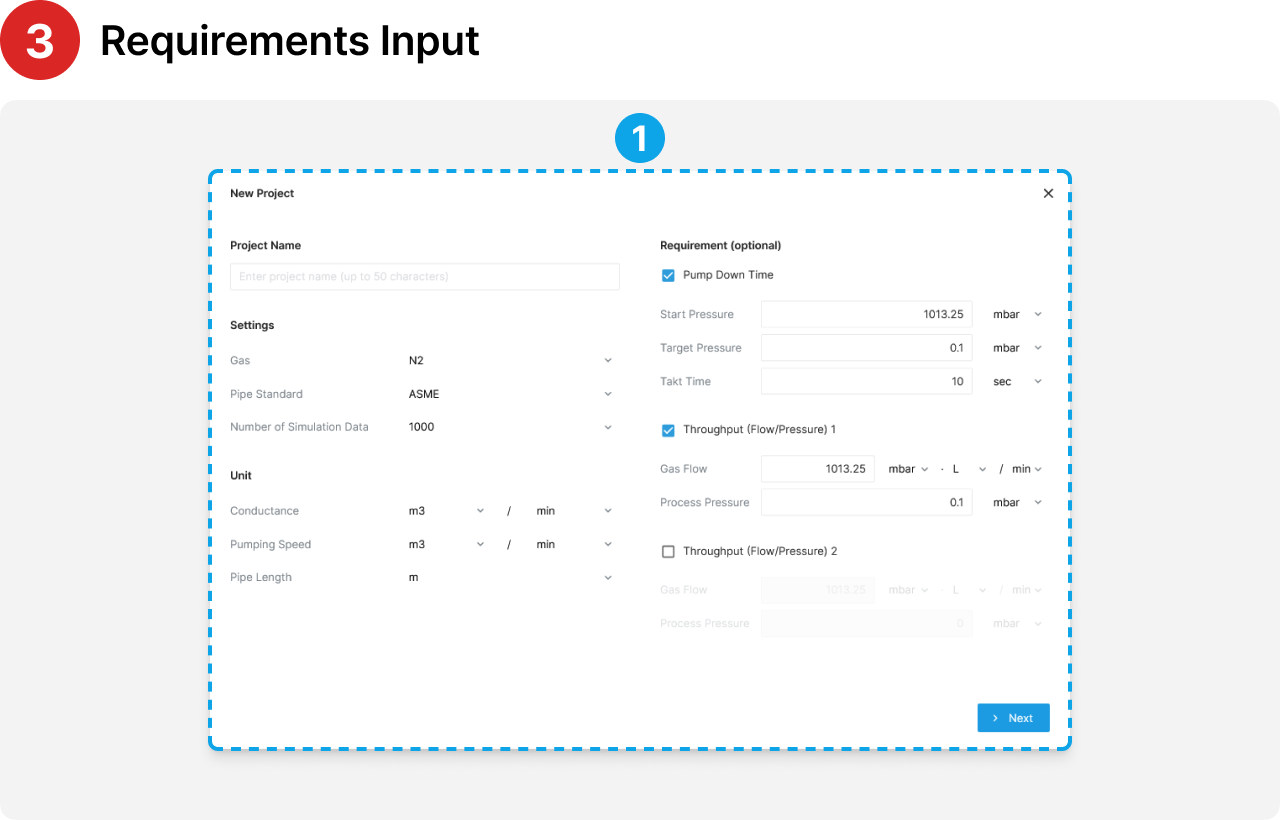
- Enter the project name and requirements
- Select the gas
- Enter the temperature
- Select the number of simulation data
- Select whether to use pipe losses option
- Select the units
- Enter the requirements for pump down time, throughput, and conductance
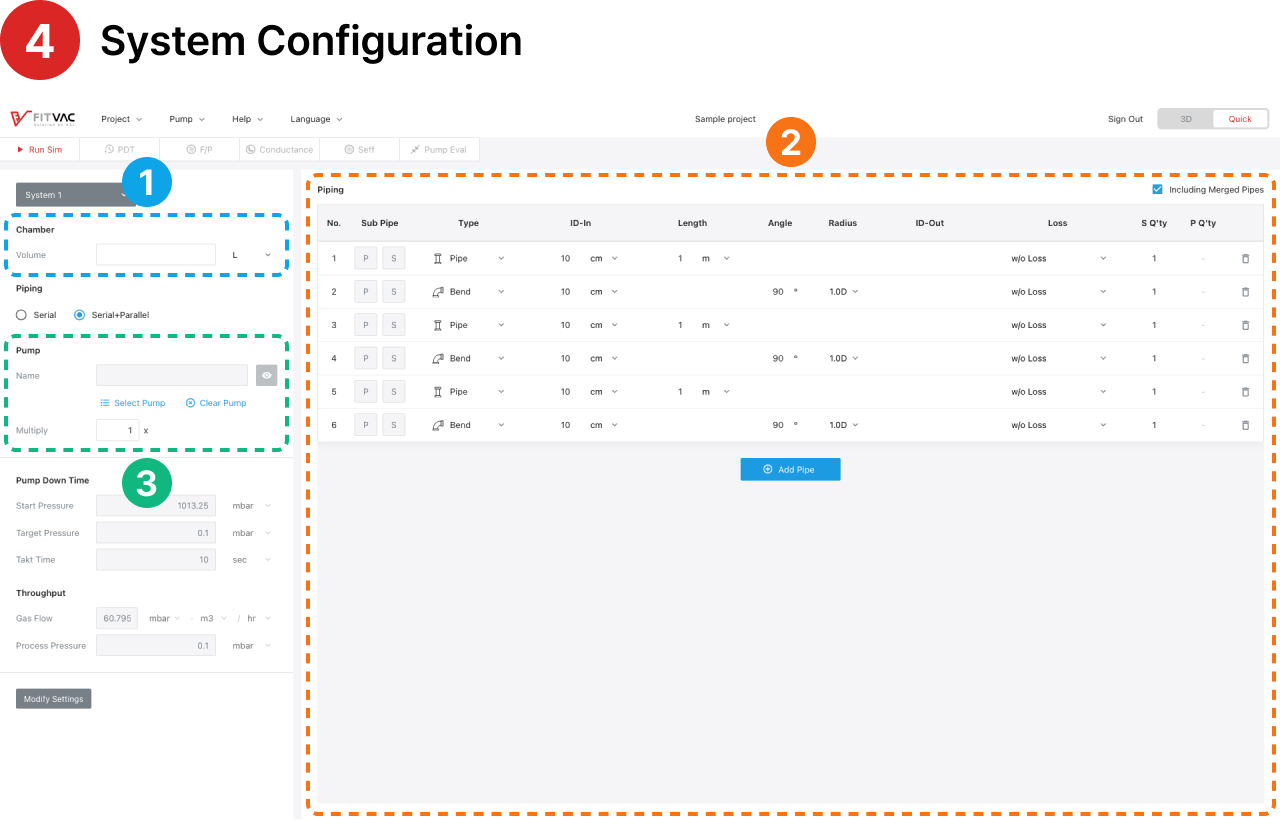
- Chamber configuration
- Enter the volume of the chamber and select the units
- Pipe configuration
- Click the "Add Pipe" button and "delete" button to add and delete pipes
- Select or enter the inlet inner diameter, length, angle, radius, outlet inner diameter, etc. of the pipe
- Pump configuration
- Click the "Select Pump" to select a pump from the list
- You can choose a sample pump or create your own
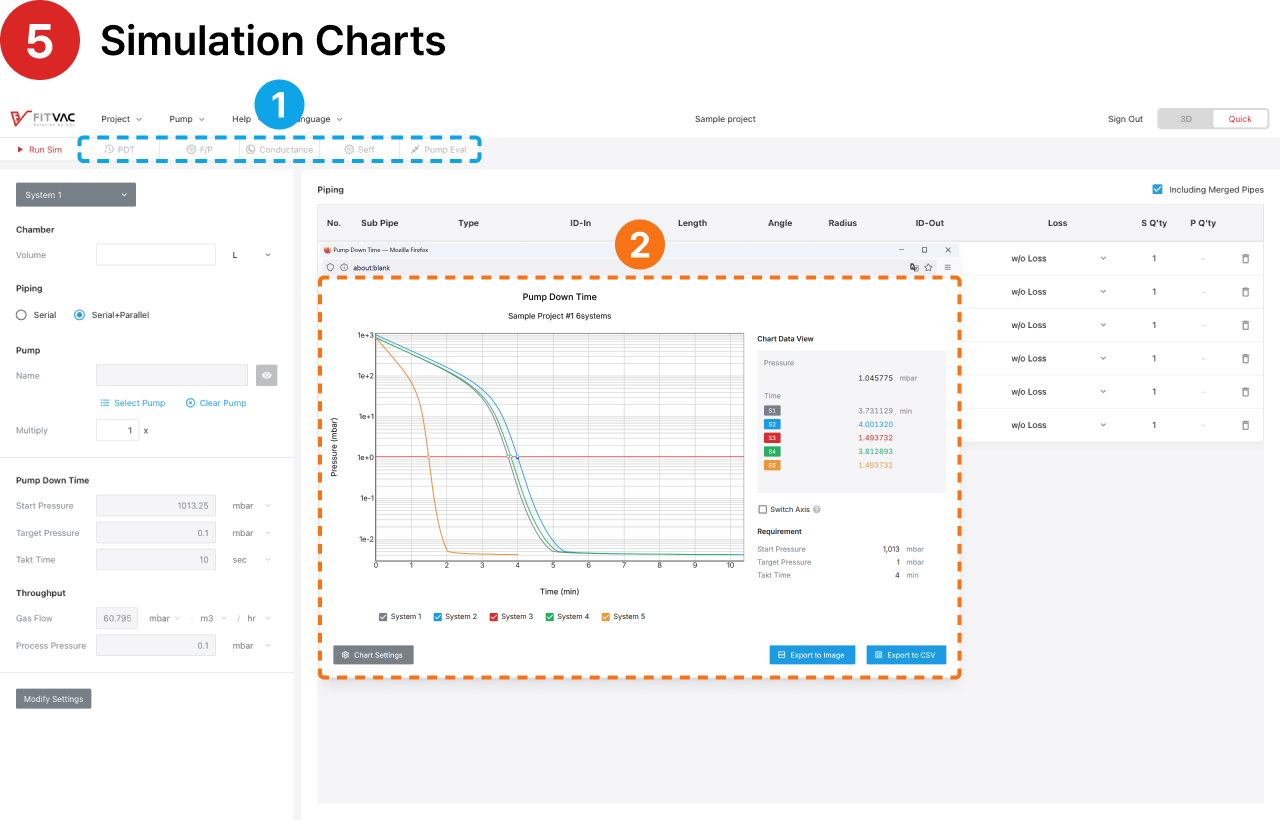
- Run the simulation
- Click the "Run Sim" button in the project menu to run a simulation
- Depending on the system configuration condition input, the simulatable buttons will be activated
- View simulation results
- Click the active button among PDT, F/P, Conductance, Seff, Pipe Eval, CapaScan™ in the project menu to display the simulation results as a pop-up
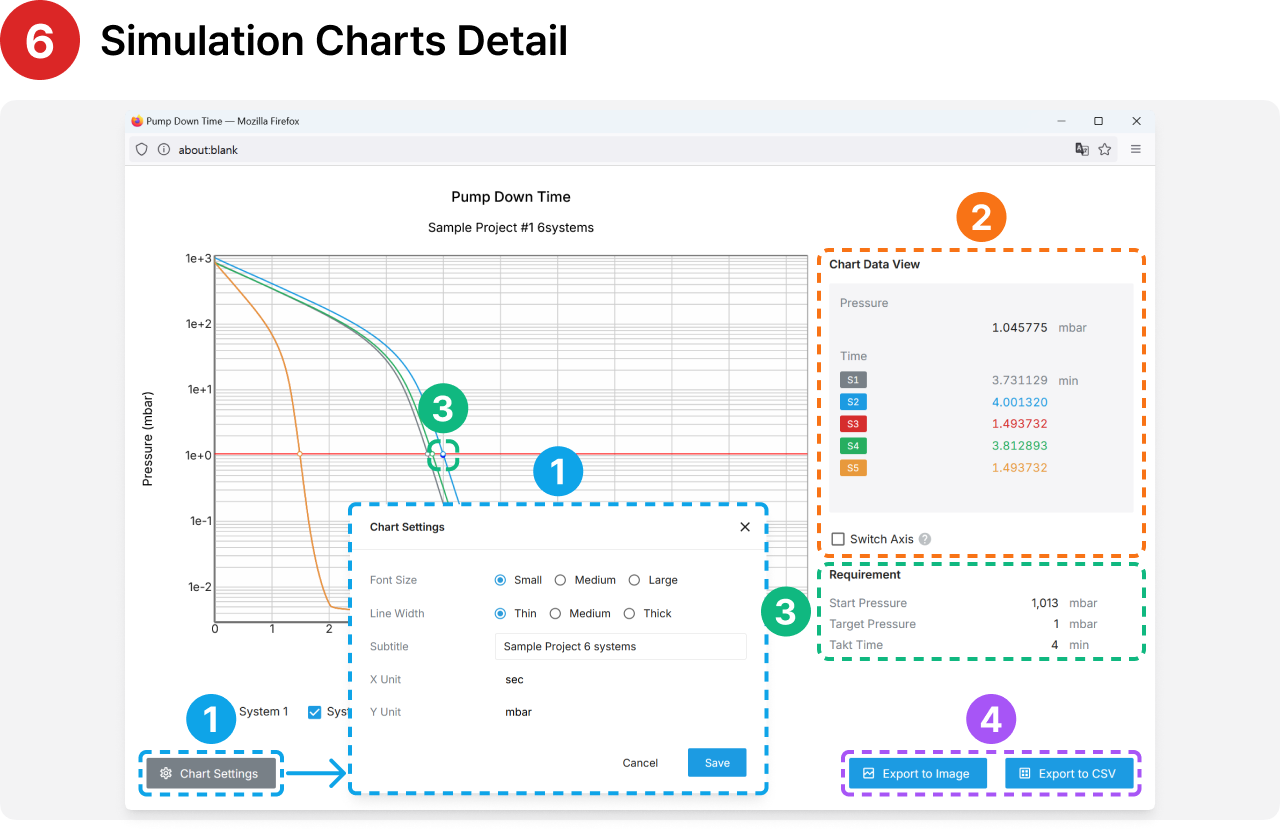
- Chart settings
- Click the "settings Chart Settings" button to customize the chart to your liking
- Font size, subheading
- X, Y axis units
- Click the "settings Chart Settings" button to customize the chart to your liking
- View simulation data
- Select "Switch Base Axis" option to view simulation results in detail
- Vacuum requirement
- Displayed on the chart as a small points(red point and blue point)
- Download simulation data
- Click the "Export to Image" button to export the chart to an image
- Click the "Export to CSV" button to export the chart to a CSV file